Mon Oct 26 17:07:43 PDT 2009
Companies and Bacteria: Modeling and Understanding Their Growth
A slight departure for TheMolecularUniverse blog, a digression on the growth of bacteria and companies.
In ideal conditions, and in the absence of competition from other creatures, disinfectants, or predators, bacteria grow until their waste products inhibit further growth. If one assumes that the initial growth rate of the bacterial colony depends on the number of bacteria present and that the effect of inhibition also increases linearly with the increasing size of the colony, you can write down a simple equation, known as the logistic, which describes the number of bacteria as a function of time.
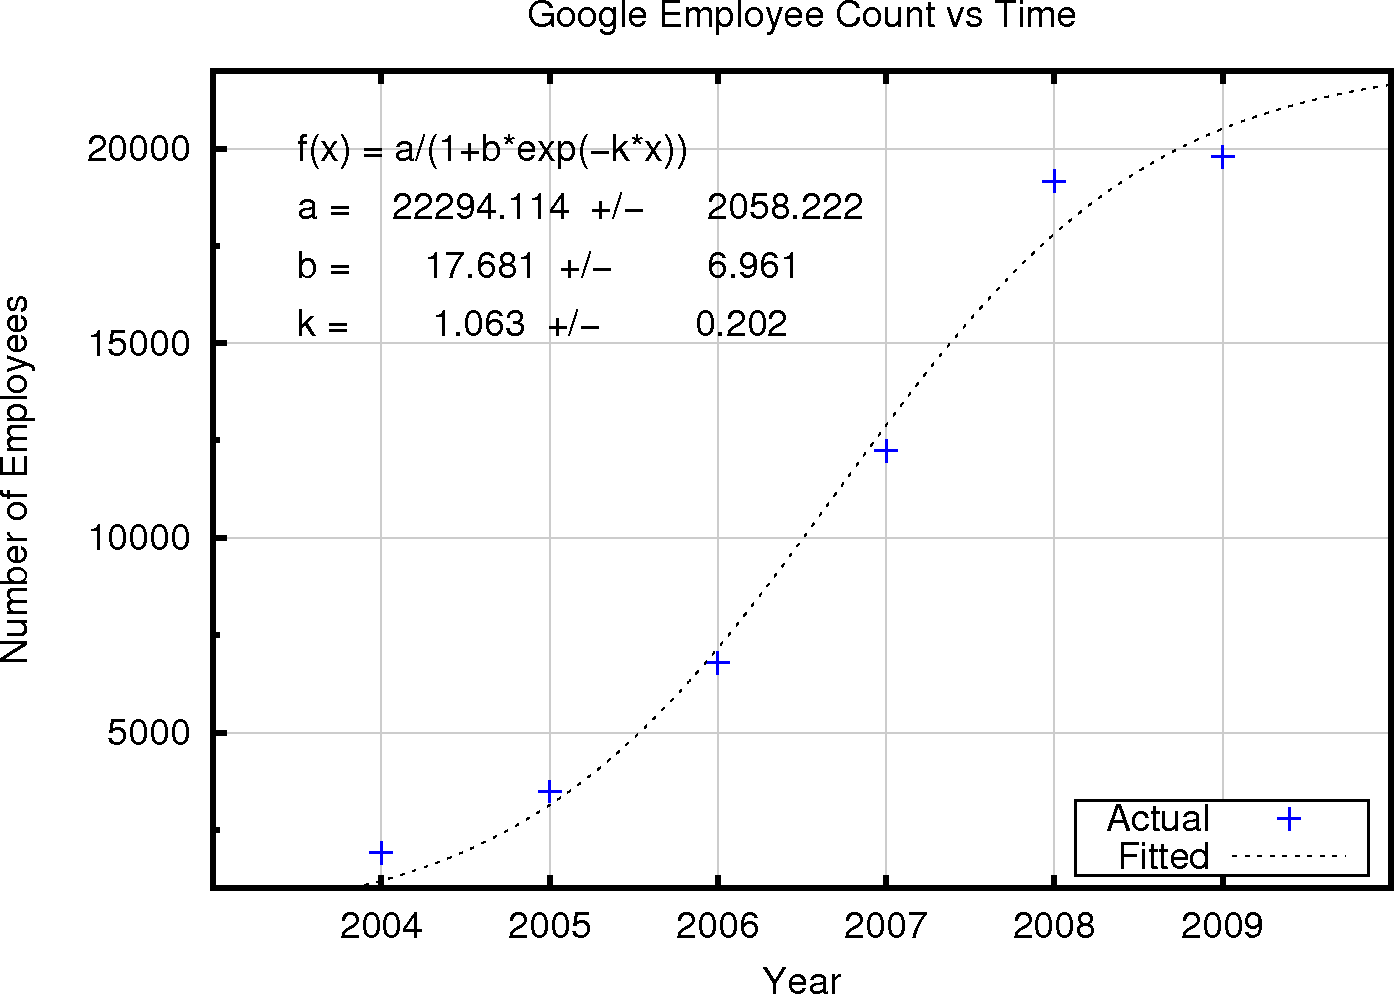
Perhaps unsurprisingly, companies behave similarly to bacteria. When a business model which works is identified, a company will grow until its growth is limited by factors such as its ability to coordinate its employees effectively. If you plot the number of Google employees versus time, and fit the resulting data points to a logistic function, you will see a curve like the one shown below. This exercise is not in itself too surprising. You have a few data points and a sigmoidal function, the logistic, with three parameters, which can be fitted to almost any data set. The acting of fitting the actual Google employee numbers provides an estimate, with estimated uncertainties, of the intrinsic growth factor of the company (which we will label 'k'), the rate of inhibition of growth (labeled 'a'), and a fitting constant, related to the solution of the differential equation which underlies the logistic, 'b'.

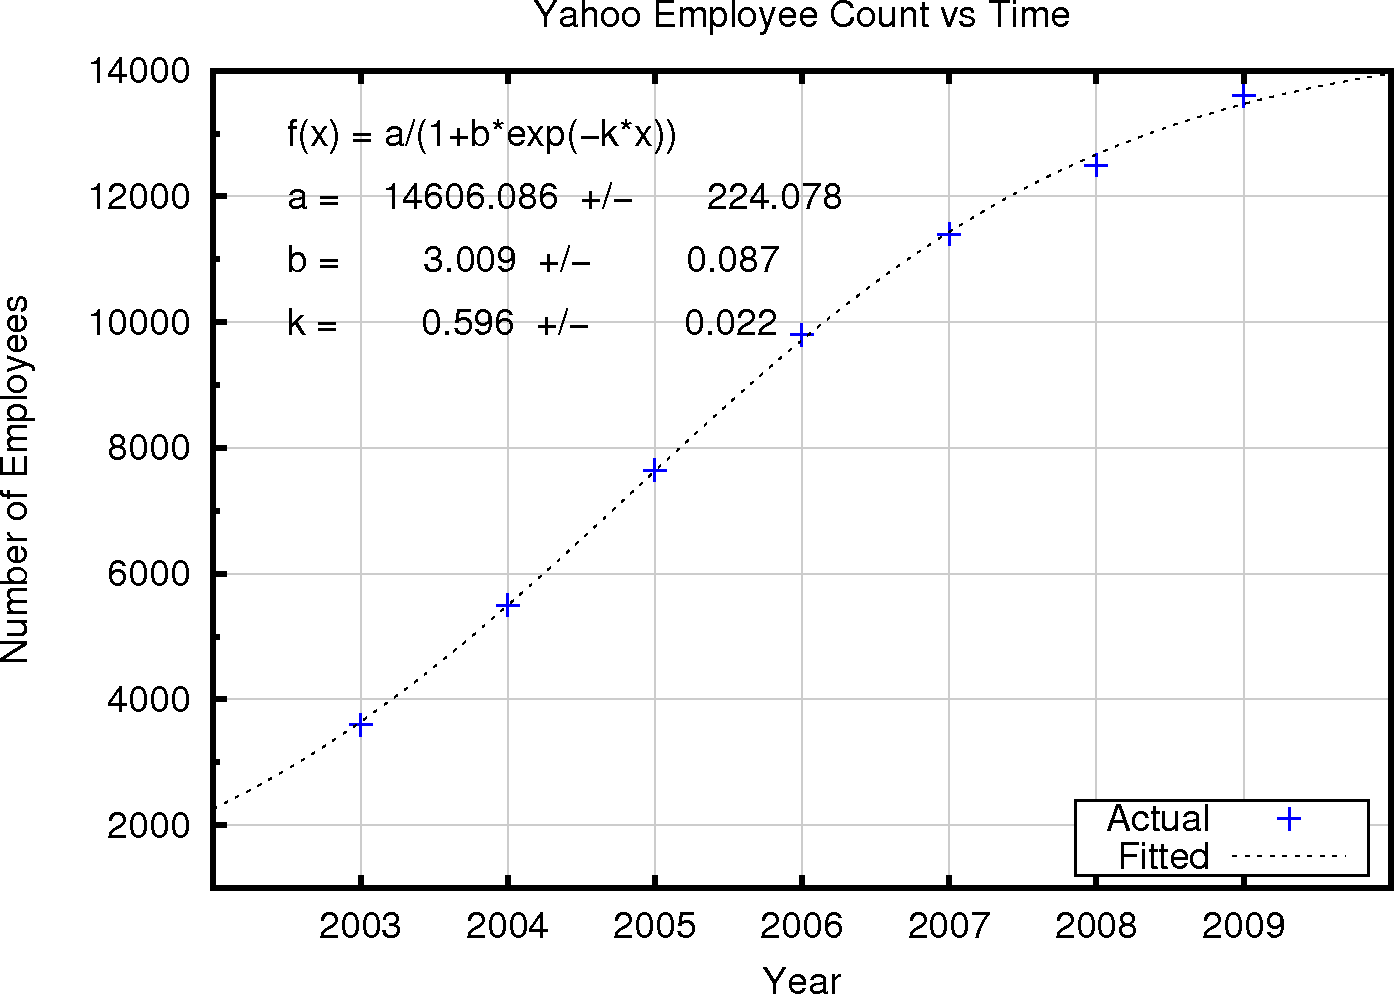
The fit for Google is quite satisfactory. The fit for Yahoo is extremely good (see below). This implies that, like bacteria, companies like Google and Yahoo do one thing and eventually begin to inhibit their own growth. Despite the marketing and executive hype, Google and Yahoo aren't reinventing themselves or evolving in new money making directions, they are doing one thing and doing it until their actions become self limiting. At least, that is what this simple model suggests.

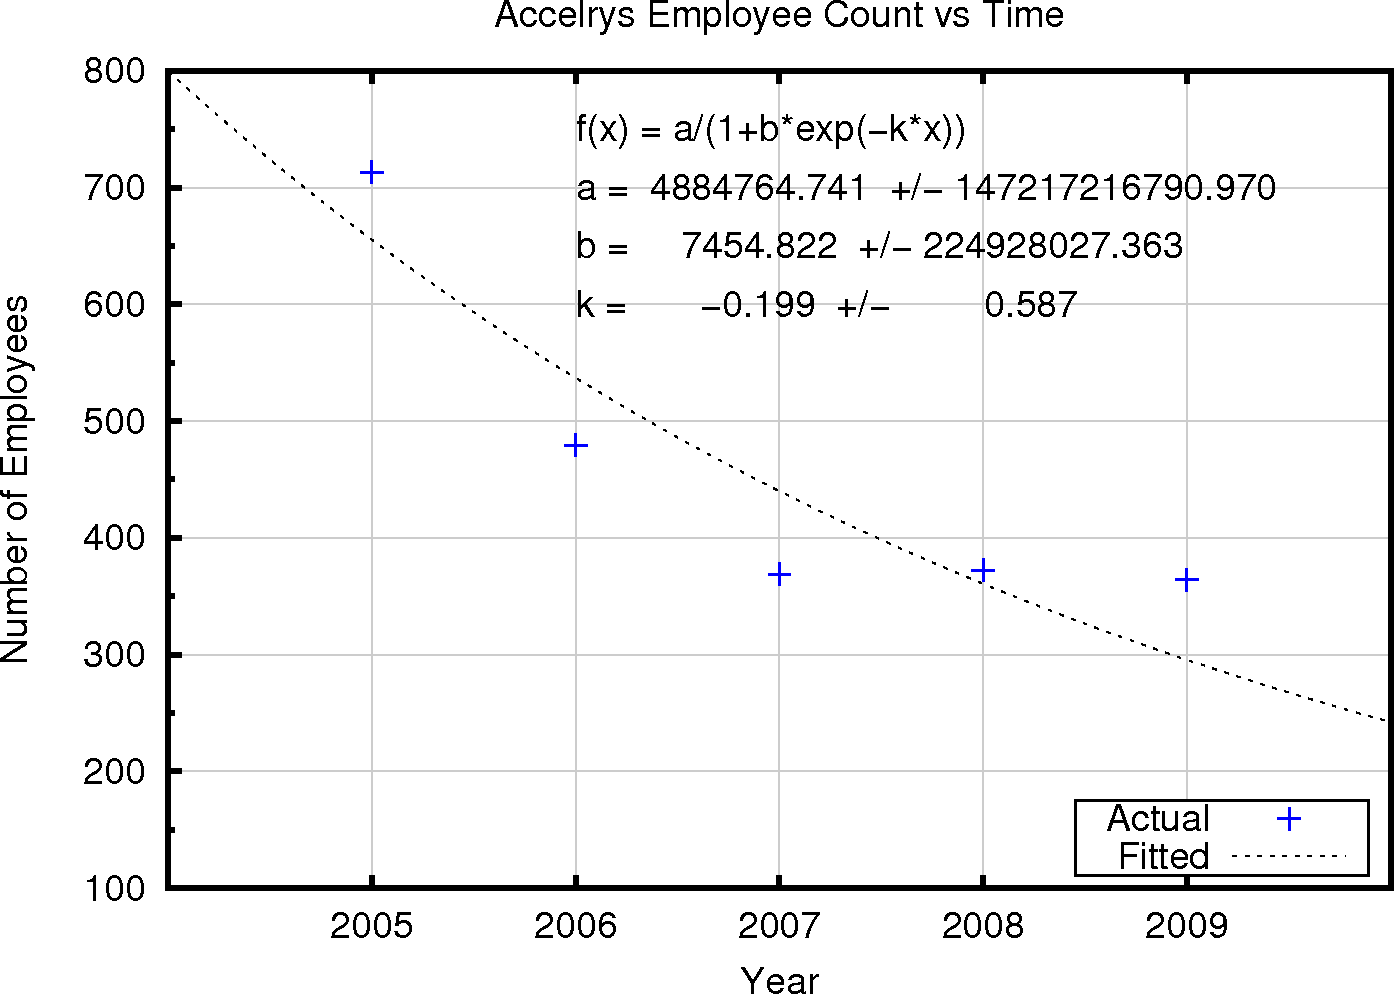
How about a company which seems to be not tending toward an equilibrium, finite size? Applying this analysis to the number of employees reported by the much smaller company Accelrys leads to the graph below. Here the k, factor relating growth to employee numbers is negative. Additionally, the quality of fit is poorer than in the case of Google or Yahoo (this can be seen by the very large estimated errors in each of the parameters). Hopefully for its customers and employees Accelrys will evolve to a different form of business model, more aligned with simple bacterial growth.

How does the logisitic function come to exist? The simple derivation is as follows: If N is the number of cells in the bacterial colony, then we speculate that the rate of change of N with respect to time is proportional to N. If we take the constant of proportionality as k, then this gives:
dNgrowth/dt = kN
the rate of increase in the number of bacteria is zero when there are no bacteria, and become higher when the colony increases in size. However, this is not the complete story, as bacteria proliferate they also secrete waste products into the environment and there is therefore a counter to colony growth which depends on colony size. This factor has no effect when the colony is small, but becomes strong when the colony is large. This can be represented as another linear function of N:
inhibition factor= 1-(1/a)N
when N is zero, the inhibition factor is 1, or irrelevant, and when N is large, the inhibition factor tends toward zero. The constant a determines the gradient of the inhibition factor with respect to the number of bacteria in the colony. By multiplying the growth rate equation and the inhibition factor equation we have an expression for the overall rate of growth of the bacterial colony:
dN/dt = kN(1-(1/a)N)
or
dN/dt = kN - (k/a)N2
or
dN/dt = kN(a - N)/a
This differential equation can be solved by collecting terms with N on one side:
dN/(N(a-N)) = (k/a)dt
and making use of a partial fraction decomposition to simplify the left hand side:
dN/aN + dN/(a(a-N)) = (k/a)dt
or
dN/N + dN/(a-N) = kdt
which on integration gives:
logN - log (a-N) = kt + c
and this rearranges to:
log (N/(a-N)) = kt + c
which can be rearranged to:
N = a/(1+exp(-kt)b)
where b = exp(-c) and so is in essence the constant of integration. k is the constant of proportionality related to growth, the higher this value, the more rapid the growth for a given colony size. Inhibition is described by a, in general the smaller this factor, the more the colony is inhibited from growing by its size.
The resulting equation for colony size with time shows how a very simple model can be used to establish an understanding of growth. The fact that it is possible to apply such a model to the size of companies, as measured by their employee bases, is also interesting. It has to be said the economists prefer more linear models, and financial wizards more complicated models including the effects of size fluctuations. However, a model which provides a simple account of the factors effecting growth has appeal. In the case of a healthy company it would seem reasonable that adding more employees should increase growth. Additionally, there should also be some negative impact of adding employees, as communication overhead increases, for example, just as the bacterial colony inhibits itself through the production of waste products. Scarily, these models allow one to predict company sizes. In 2010, for example, we can estimate that Google will have 21,640 employees, Yahoo will have 13,960, and Accelrys will have 242. Unless, of course, they evolve! (These extrapolations are made in October 2009, we will have to see what happens in practice).
As Google, Yahoo, and Accelrys are public companies, they report employee counts from time to time. I have made use of the records posted by Yahoo for each company to obtain the information for the diagrams shown here, I used the 'WayBack Engine' internet archive to obtain pages for past years.